

When I was a beginner in trading, I didn’t know about candlestick patterns and what they meant. I only bought stock at a low price and sold it at a high price. Because of my lack of knowledge, I have lost so much money. When I shared my story of loss with my friend, he recommended me to analyse candlestick patterns. That is the first time I have heard about candlestick pattern analyses. From that day I have started to learn about candle stick analysis. Now I know, what is going on in the market, What is going to be next? It is sure that you can’t be a successful trader by only learning candlestick patterns. I am sure by reading this article you will be completed almost 20% to be a successful trader.
Hey there stock market enthusiasts! Today, I’ve got some awesome content for you. I’m gonna break down all these super important candlestick patterns that’ll help you make mad profits in the stock market.
I’ve done a ton of research for this, reading books and blogs like “How to Make Money Trading with Candlestick Charts” by Balakrishna Sadekar. So, let’s dive in and start making that money!
I guarantee you that this post is going to be the most helpful tutorial that you ever read in your life about candlestick patterns. If you have any doubts related to this post, you can ask them on our Marketnasium forum site. So take a notebook and start learning.
What is a candle stick chart?
A candlestick chart shows the price movements of a financial asset using candlesticks. Traders find it useful because it is accurate and easy to understand.

The body of the candlestick is typically coloured green or white if the closing price is higher than the opening price. If the closing price is lower than the opening price, it is coloured red or black. The wicks or tails of the candlestick extend above and below the body, representing the highest and lowest prices reached during the period.
Why Candle stick chart?
Ah, the mystical art of candlestick charts! Like a sly magician, they dance and sway, casting their enchanting shadows on the world of finance. Picture it: rows and rows of little candlesticks, each one representing the rise and fall of stocks and currencies. But why, you may wonder, do we rely on these flickering flames to guide our investments? It’s a bit like seeking wisdom from a clairvoyant candle, don’t you think? Just remember, my friend, when it comes to financial predictions, sometimes you need a little bit of magic to light the way!
Candlestick charts are believed to have been developed in the 18th century by Munehisa Homma, a Japanese rice trader. Homma used candlestick charts to analyze the price of rice contracts and to identify trading opportunities.
Candlestick charts are a valuable tool for traders and investors because they provide a visually appealing and informative way to view price movements. Candlestick patterns can be used to identify potential trading opportunities and to assess the strengths and weaknesses of a trend.
They can be used to identify potential trading opportunities and to assess the strengths and weaknesses of a trend. For example, a bullish candlestick pattern may indicate that the price is likely to continue to rise, while a bearish candlestick pattern may indicate that the price is likely to fall.
Candlestick charts can also be used to analyze different types of securities and time frames. They are commonly used to analyze stocks, forex currencies, futures contracts, and ETFs. Candlestick charts can also be used to analyze price movements over any period of time, including intraday, daily, weekly, and monthly charts.
Candlestick pattern names are only for reference. Focus on understanding what is happening in each pattern.
Morubozu
A Marubozu candlestick is a long-bodied candlestick with no upper or lower shadow, meaning that the open and closing prices are the same as the high and low prices. The word “Marubozu” is Japanese for “bald head”, which describes the lack of shadows on the candlestick.

Bullish and Bearish Morubozu
A bullish Marubozu candlestick has a white or green body and opens at a low price and closes at a high price. This indicates that there was strong buying pressure during the trading session and that buyers were able to push the price higher throughout the session.
A bearish Marubozu candlestick has a black or red body and opens at a high price and closes at a low price. This indicates that there was strong selling pressure during the trading session and that sellers were able to push the price lower throughout the session.
Analyse trend reversal using a Marubozu
To find a trend reversal using a Marubozu candlestick, you need to look for a candlestick that forms against the direction of the prevailing trend. For example, if the stock has been in an uptrend, you would look for a bearish Marubozu candlestick.
Once you have identified a Marubozu candlestick that forms against the direction of the prevailing trend, you need to wait for confirmation before taking a trade. One way to confirm the signal is to wait for the stock to close below the low of the Marubozu candlestick.
Tips for trading trend reversals using Marubozu candlesticks:
- Only trade trend reversals when they are confirmed. For example, wait for the stock to close below the low of the bearish Marubozu candlestick before shorting the stock.
- Use other technical indicators to confirm the signal from the Marubozu candlestick. For example, look for a break in the trend line or a divergence in the MACD indicator.
- Place a stop loss above the high of the Marubozu candlestick to protect your profits.
- Be patient and don’t rush into trades. It is better to miss a trade than to take a bad trade.
Doji

A Doji candlestick pattern is a special type of candlestick that is characterized by a very small or nonexistent real body. This means that the opening and closing prices are very close together, or even identical. Doji candlesticks can have long or short shadows, but the real body is always very small.
Doji candlesticks are often seen as a sign of indecision in the market. This is because neither the buyers nor the sellers were able to gain control of the price during the trading session. As a result, the price closed at or near the opening price.
However, Doji candlesticks can also be seen as a sign of potential trend reversals. This is because a Doji candlestick can signal that the buyers or sellers are starting to lose momentum. For example, if a Doji candlestick forms after a long uptrend, it could be a sign that the uptrend is starting to lose steam and that a downtrend may be developing.
- Standard Doji: A standard Doji occurs when the opening and closing prices are nearly identical, resulting in a small or nonexistent body. It represents indecision in the market, indicating a potential reversal or continuation of the current trend.
- Long-Legged Doji: A long-legged Doji has long upper and lower shadows with a small body in the middle. This pattern suggests a high level of indecision and uncertainty. It often represents a balanced market, signalling a potential reversal or continuation of the current trend.
- Dragonfly Doji: The Dragonfly Doji has a long lower shadow and little to no upper shadow, with the opening and closing prices at or near the session high. It is perceived as a bullish reversal pattern, indicating that sellers were unable to maintain control and buyers may take over.
- Gravestone Doji: The Gravestone Doji has a long upper shadow and little to no lower shadow, with the opening and closing prices at or near the session low. It is considered a bearish reversal pattern, suggesting that buyers were unable to sustain their dominance and sellers may take control.
- Spinning Top: The Spinning Top has a small body with upper and lower shadows of similar length. It signifies indecision and a tug-of-war between buyers and sellers. The Spinning Top may appear in various market conditions and does not provide a strong directional signal on its own.
Hamer and hanging man
Hammer

A hammer candlestick pattern is a bullish reversal pattern that occurs at the end of a downtrend. It is characterized by a small real body near the top of the candle and a long lower shadow. The lower shadow should be at least twice the size of the real body.
The hammer candlestick pattern suggests that the sellers were initially in control of the price, but the buyers were able to step in and push the price back up to close near the opening price. This indicates that the buyers are starting to gain momentum and that a trend reversal may be imminent.
Hanging man

A hanging man candlestick pattern is a bearish reversal pattern that occurs at the end of an uptrend. It is characterized by a small real body near the top of the candle and a long lower shadow. The lower shadow should be at least twice the size of the real body.
The hanging man candlestick pattern suggests that the buyers were initially in control of the price, but the sellers were able to step in and push the price back down to close near the opening price. This indicates that the sellers are starting to gain momentum and that a trend reversal may be imminent.
The Hamer and hanging man candlestick pattern is most reliable when it forms at the end of a strong uptrend. It is also important to note that a hanging man candlestick pattern is not a guarantee that a trend reversal will occur. However, it is a useful tool for identifying potential trend reversals.
Ask your doubts with our community
Discuss personal finance and markets with experts and other investors, get unique opinions and insights, and learn from the best.
Inverted hammer and Shooting star

Inverted hammer
An inverted hammer candlestick pattern is a bullish reversal pattern that occurs at the end of a downtrend. It is characterized by a small real body near the bottom of the candle and a long upper shadow. The upper shadow should be at least twice the size of the real body.
The inverted hammer candlestick pattern suggests that the sellers were initially in control of the price, but the buyers were able to step in and push the price back up to close near the opening price.
This indicates that the buyers are starting to gain momentum and that a trend reversal may be imminent.
Shooting star
A shooting star candlestick pattern is a bearish reversal pattern that occurs at the end of an uptrend. It is characterized by a small real body near the top of the candle and a long upper shadow. The upper shadow should be at least twice the size of the real body.
The shooting star candlestick pattern suggests that the buyers were initially in control of the price, but the sellers were able to step in and push the price back down to close near the opening price.
This indicates that the sellers are starting to gain momentum and that a trend reversal may be imminent.
Bullish engulfing and Bearis engulfing
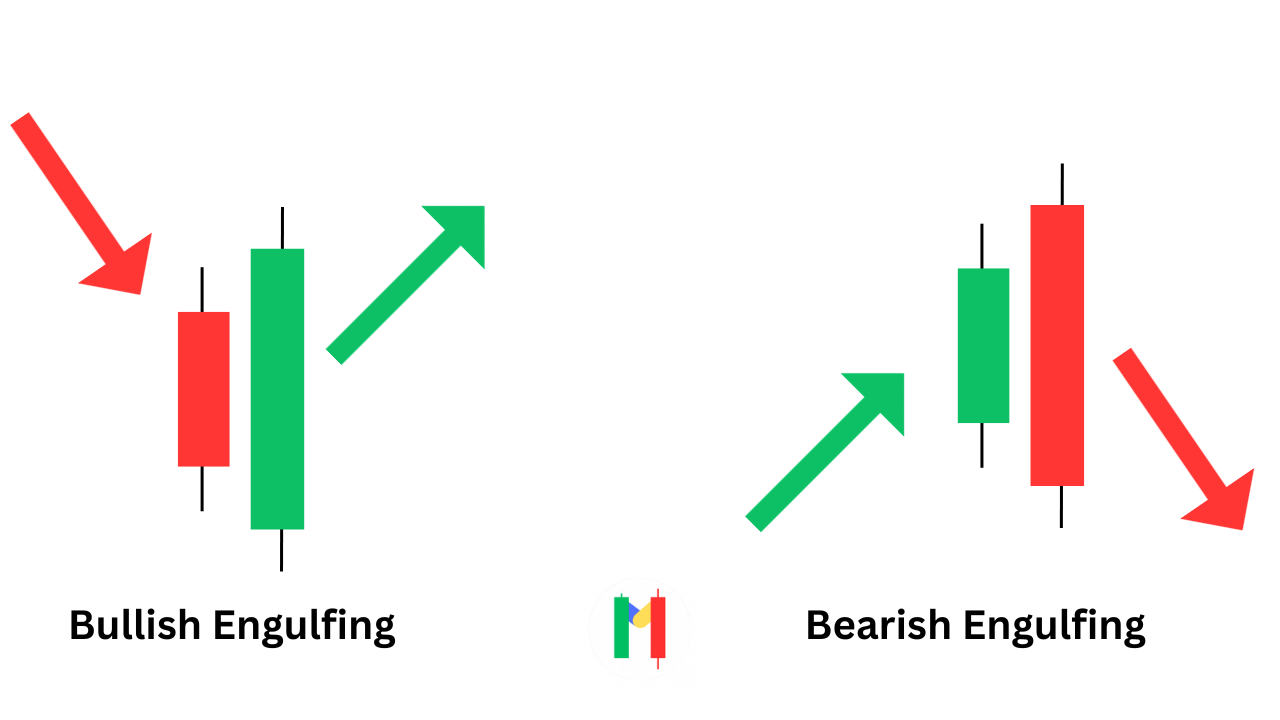
Bullish engulfing
A bullish engulfing candlestick pattern is a two-candle reversal pattern that forms at the end of a downtrend. It is characterized by a small black candlestick followed by a large white candlestick that completely engulfs the body of the black candlestick.
The bullish engulfing pattern suggests that the bears are losing control of the market and that the bulls are taking over. This pattern is often seen as a sign of a potential trend reversal.
Bearish engulfing
A bearish engulfing candlestick pattern occurs at the end of an uptrend and is characterized by a small white candlestick followed by a large black candlestick that completely engulfs the body of the white candlestick.
This pattern suggests that the bulls are losing control of the market and that the bears are taking over.
Harami
The Harami candlestick pattern is a two-candle reversal pattern that can form at either the top or bottom of a trend. It is characterized by a small candlestick with a body that is completely contained within the body of the previous candlestick. The Harami pattern can be either bullish or bearish, depending on the direction of the preceding trend.

Bullish Harami
A bullish Harami candlestick pattern forms at the bottom of a downtrend and suggests that the downtrend is losing momentum and that a reversal is possible. The bullish Harami is characterized by a small green candlestick with a body that is completely contained within the body of the previous red candlestick.
Bearish Harami
A bearish Harami pattern forms at the top of an uptrend and suggests that the uptrend is losing momentum and that a reversal is possible. The bearish Harami is characterized by a small red candlestick with a body that is completely contained within the body of the previous green candlestick.
Dark cloud and piercing

The dark cloud cover and piercing candlesticks are two reversal candlestick patterns that can be used to identify potential trend reversals.
Dark cloud cover
The dark cloud cover pattern is a bearish reversal pattern that forms at the top of an uptrend. It is characterized by a large green candlestick followed by a large red candlestick that opens above the close of the green candlestick and closes below the midpoint of the green candlestick. This pattern suggests that the bulls are losing control of the market and that the bears are taking over.
Piercing line
The piercing line candlestick pattern is a bullish reversal pattern that forms at the bottom of a downtrend. It is characterized by a large red candlestick followed by a large green candlestick that opens below the open of the red candlestick and closes above the midpoint of the red candlestick. This pattern suggests that the bears are losing control of the market and that the bulls are taking over.
Morning star and Evening star
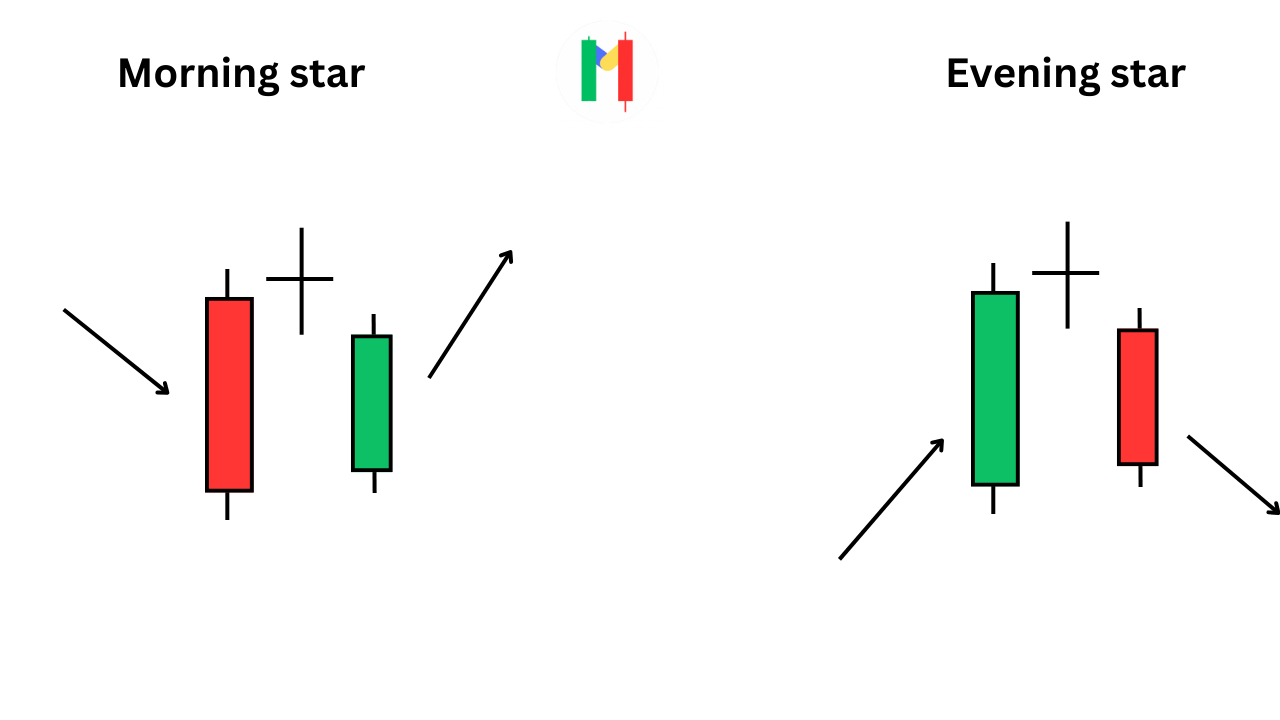
The morning star and evening star candlestick patterns are two reversal patterns that can be used to identify potential trend reversals. The morning star pattern is a bullish reversal pattern that forms at the bottom of a downtrend.
It is characterized by three candlesticks: A large black A small-bodied candlestick with a short upper shadow, a long lower shadow and A large white candlestick.
The morning star pattern suggests that the bears are losing control of the market and that the bulls are taking over.
The evening star pattern is a bearish reversal pattern that forms at the top of an uptrend. It is characterized by three candlesticks: A large white candlestick, A small-bodied candlestick with a short lower shadow and a long upper shadow and A large black candlestick
The evening star pattern suggests that the bulls are losing control of the market and that the bears are taking over.
Tips for trading Morning Star and Evening Star
- Look for confirmation from other technical indicators. For example, you could look for a break in the trend line or a divergence in the MACD indicator.
- Place a stop loss below the low of the small-bodied candlestick in a morning star pattern or above the high of the small-bodied candlestick in an evening star pattern. This will help to protect your profits and limit your losses.
- Take profits when the price reaches your target. It is important to have a profit target in place before taking any trade. This will help you to lock in your profits and avoid giving back your winnings.
Ask your doubts with our community
Discuss personal finance and markets with experts and other investors, get unique opinions and insights, and learn from the best.
Conclusion
In conclusion, understanding and analyzing candlestick patterns is a crucial skill for anyone involved in the stock market or trading in general. These patterns provide valuable insights into market trends, allowing traders to make informed decisions and potentially increase their chances of success.
By studying candlestick charts and familiarizing yourself with various patterns like Marubozu, Doji, Hammer, Hanging Man, Inverted Hammer, Shooting Star, Bullish Engulfing, Bearish Engulfing, Harami, Dark Cloud Cover, Piercing Line, Morning Star, and Evening Star, you can gain a deeper understanding of market dynamics and identify potential trend reversals.
However, it’s important to remember that candlestick patterns alone do not guarantee profitable trades. It’s crucial to use them in conjunction with other technical indicators, perform a thorough analysis, and exercise risk management strategies.
So, if you’re a stock market enthusiast looking to enhance your trading skills, take the time to study and practice identifying and analyzing candlestick patterns. It may take some time and effort, but the knowledge and insights gained from mastering these patterns can greatly improve your trading journey. Happy trading!


